Part 2 of 2: Analyze Rates
In the last article, we discussed how the first step to achieving profitability is to examine the facility utilization rate and labor sales potential. Once the potential has been calculated, comparing the efficiency, productivity, proficiency, and penetration rates will reveal areas of needed improvement.
Effective Labor Rate (ELR)
The ELR is the true labor rate of a shop after discounts and adjustments. The ELR is found by dividing the total labor revenue by the total flat-rate hours billed during the reporting period.
How to Improve? If the effective labor rate is less than the posted rate, review exception reports for labor discounts to determine the cause. Taking time to train the advisors, technicians, and dispatchers on proper job pricing and quoting is necessary in order to maximize the ELR. In addition, oil changes and other services that are discounted to bring customers in the door will lower the ELR, while preventive maintenance services will raise the ELR. Institute a policy of preventive maintenance checks, reminders, and upsells on the service drive to maximize the ELR.
Shop and Technician Efficiency Rates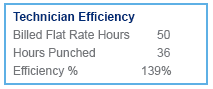
The efficiency rate is found by dividing the billed flat-rate hours by the actual punched hours during the reporting period. The efficiency rate should be tracked for individual technicians and for the shop as a whole. The minimum result for both is 100% efficiency with a minimum sustainable goal of 125%.
How to Improve? Technician training and appropriate skill-level dispatching are essential to maximize the technician efficiency rates. Also, review the quoting procedures of the technicians and service advisors to ensure that diagnostic time is being billed correctly.
Technician Productivity Rate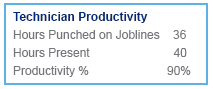
The technician productivity rate is found by dividing the actual hours technicians punch on job lines to the hours the technicians are physically present and available for work during the reporting period. This number shows how effectively the technicians are utilizing their working hours.
How to Improve? If this number is low, review common productivity-killing employee habits such as smoke breaks and employee socializing.
Technician Proficiency Rate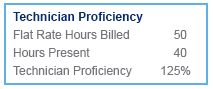
The technician proficiency rate is found by dividing the billed flat-rate hours by the hours technicians are physically present and available for work during the reporting period. The proficiency rate is a combination of the technician’s efficiency and productivity and can be affected by numerous factors.
How to Improve? If proficiency rates are low, verify that diagnostic and access times are being correctly billed as a separate flat-rate line items and not rolled into the billable hours of the primary repair. You can further maximize proficiency rate by instigating a streamlined dispatching process to ensure parts are charged out and delivered directly to the service bays so technicians are not waiting for lot porters to bring the next assigned unit.
Labor Type Penetration Rate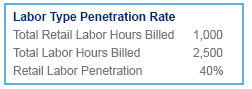
The labor-type penetration rate is found by dividing the number of hours billed for the labor type (retail, warranty, or internal) by the total hours billed during the reporting period. The penetration rate should be tracked for individual advisors and for the service department as a whole.
This number shows how effectively the advisors are upselling maintenance services. Ideally, the retail penetration rate should be much higher than the warranty or internal penetration rates. Warranty revenue is unreliable and carries a lower gross. Internal revenue is only a shift of profit from one department to another and does not benefit the dealership.
How to Improve? If the labor type penetration rate is low, train advisors to effectively upsell retail maintenance and accessories on the service drive.
Parts-to-Labor Ratio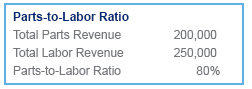
The parts-to-labor ratio is found by dividing the parts revenue by the labor revenue in the service department during the reporting period. On average, the gross on parts is 35%, while gross on labor is 75%. Maximizing labor sales results in higher departmental profit margins.
The benchmark is a parts-to-labor ratio of 0.8 to 1.
How to Improve? If parts revenue is higher than the labor revenue, evaluate if the labor rate is too low, the parts markup is too high, or if advisors are correctly billing and upselling labor.
In summary, to enhance service department’s profitability:
- Analyze the service department’s potential and key performance indicators to determine areas of improvement on a monthly basis.
- Implement a policy of training for the technicians, advisors, and dispatch that focuses on efficiency, upselling, and correctly quoting and billing flat-rate codes.
- Ensure that jobs are being dispatched to the appropriate skill-level technicians.
- Verify that the service department is clean, stocked with the appropriate tools, and organized for efficient workflow.
- Review part stocking levels for all maintenance parts and commonly needed items.
- Finally, institute a culture of positive recognition and profitability in the service department, which may include bonuses or spiffs to reward employees for meeting efficiency and productivity goals.